From Folders of Spreadsheets to a Web Data Portal

Someone asks your team for a subset of your data. A particular region, a particular set of years, a particular set of measurements.
The request is reasonable. The data exists. But answering it means opening several files, remembering which version is current, checking whether those particular records can be shared, filtering by hand, and sending back a spreadsheet. It takes forty minutes if the person doing it knows the data well.
And it is always the same person.
Somewhere else, in a different kind of organization, a quarterly report is being assembled. The monitoring data goes back eight years. Every quarter, someone pulls the numbers together by hand, and every quarter it is built from scratch, because last time’s version does not fit this time’s question.
This is the same problem. Not missing data, and not bad data. Data that exists is valuable and is reachable only by going through a human being.
A note on why I am writing this. I should say where I am standing while I write this. I did a PhD in economics before I moved into software, and I spent a lot of it on the wrong side of this exact problem—pulling figures out of Excel files exported from several different platforms, none of which agreed on how a field should be named or what a missing value meant. The analysis was the small part. Getting the data into a state where analysis was possible was most of the work, and it was work nobody counted, funded, or saw.
I am now building out this direction at DjangoStars—data platforms for research and monitoring organizations—and it is the part of our work I have made my own. That means the conversations before a project exists: working out what a group actually has, what they need it to do, and whether we are the right people for it at all. The platforms described further down are the work of our engineers rather than mine. My contribution is the problem, not the code: understanding it precisely enough that what gets built answers the real question instead of the one that was easiest to write into a brief.
I talk to universities, research institutes, and organizations across Switzerland, Germany, Austria, and the Nordics about this every week, and what surprised me is how little it varies. Different countries, different disciplines, very different budgets—the same folder of spreadsheets, and the same one person who knows where things are. Often the honest answer is that a group does not need a platform at all, and the sections below on when not to build one come out of those conversations as much as out of the ones that became projects.
Why every data request lands on the same person
If your organization has been collecting data for more than a few years, you probably recognize some version of this:
- One person knows where everything is and how the older files differ from the newer ones. When they are on leave, data requests wait.
- People outside your team ask for data by email—researchers, partners, journalists, and member organizations. Every request is handled manually.
- The same figures get reassembled by hand for each report, each funder update, and each quarter.
- Data collected under a project that ended is technically still on a server and practically gone. Nobody remembers the naming convention.
- You cannot open the data publicly, because some of it is restricted, and separating the two would take work nobody has budgeted for.
- The work you have done is real and almost invisible to anyone who was not in the room.
The common thread is not technical debt. Access to your data is mediated by a person, and that person’s time is finite. Every additional user worsens the bottleneck, which quietly creates a reason not to promote the data at all.
Evidence suggests this ends badly if left alone. A study of 516 datasets from papers published over two decades found that the odds of a dataset still being available fell by roughly 17% per year after publication. Data kept by individuals often becomes unreachable as hardware, formats, and staff change. The same decay applies to any dataset whose custody depends on one person remembering. Separately, Splunk’s survey of over 1,300 business and IT leaders found that 55% of an organization’s data is “dark”—data they either do not know exists or cannot find, prepare, or use.
What this looks like across different kinds of organizations
We have had versions of this conversation with teams in many different places, and the striking thing is how little the sector changes the story.
Universities and research centers
Years of measurements across projects and field campaigns, held in folders that follow a naming convention someone invented in 2014. External researchers ask for slices of it. A funder asks what the impact was.
NGOs and monitoring agencies
Program and monitoring data going back a decade, collected by field teams on forms that changed twice along the way. Quarterly reporting is a manual assembly job. The impact is real and almost impossible to show to a donor without a week of preparation.
Energy and utilities
Asset registers, inspection records, meter and consumption histories, often spread across a GIS layer, a maintenance system, and a set of spreadsheets that reconcile the two. Long asset lifetimes mean the historical series is genuinely valuable and genuinely awkward—formats and standards changed several times across it.
Logistics operators and freight brokers
Years of shipments, routes, lanes, carrier performance, and rates. Analysts build the same lane performance and seasonality views over and over, and the forecasting model lives in a workbook one person maintains while everyone else waits.
Public bodies, environmental agencies, port and water authorities, industry associations, archives, and museums. Same pattern again: a long series, a mandate to make it available, and a bottleneck made of one person’s time.
The details differ. The shape does not:
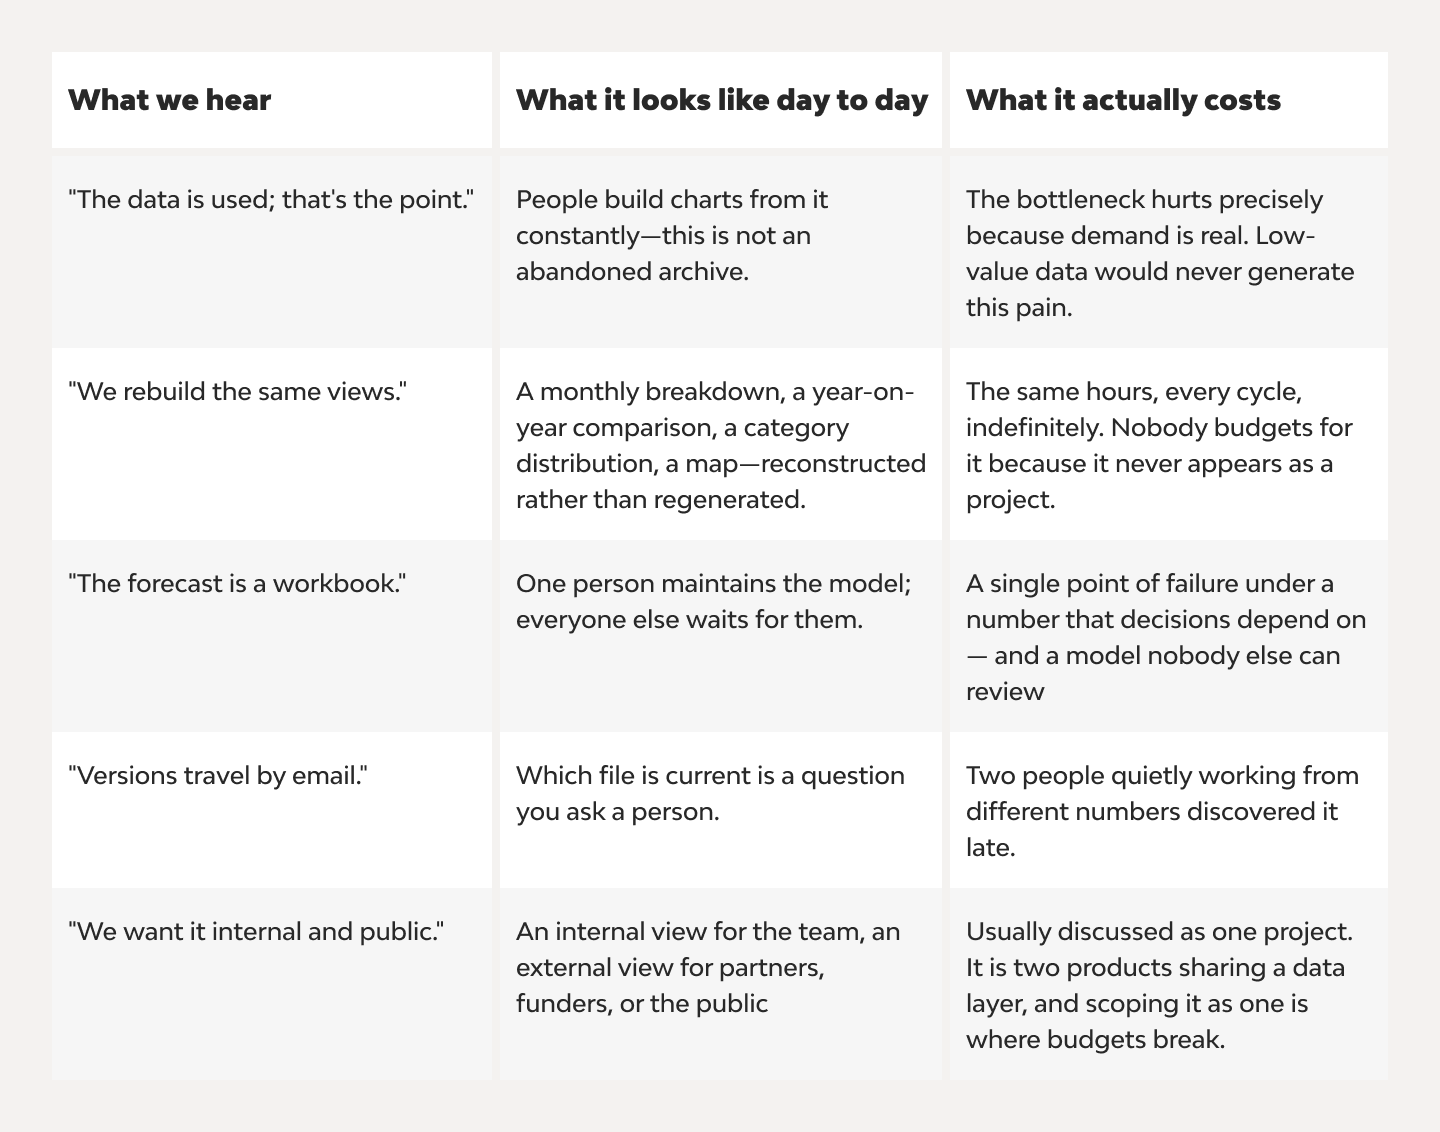
There is a reason to take the spreadsheet layer seriously rather than treating it as a harmless interim step. Field audits of operational spreadsheets have consistently found errors in the vast majority of those examined—in the most methodologically careful audits, at least 86%. The finding worth sitting with is the confidence gap. When developers were asked to estimate the probability that their own spreadsheet contained an error, the average estimate was 18%, while the actual rate in the same group was 86% .1 The problem is not that people are careless with spreadsheets. It is that nobody, including the author, can tell by looking.
That is the argument for moving the calculation into a tested, version-controlled system, and it holds whether the output is a public data portal or an internal view for six analysts.
This is for you if you have said any of these out loud
From universities and research centers:
“We have fifteen years of measurements. They are in a few hundred Excel files, and one person on the team can actually find things in them.”
“Outside researchers email us for data. Every request gets handled by hand, and it eats the week.”
“We collected data nobody else has. It is barely cited. The next funder will ask what the impact was, and I do not have a good answer.”
From NGOs and monitoring organizations:
“We have eight years of monitoring data. It sits in tables, and nobody outside the team ever sees it.”
“Every quarter we build the donor report from scratch. It takes four days, and it is the same four days each time.”
“The impact is real. Showing it to a funder takes a week of preparation, so mostly we do not show it.”
From energy and utilities:
“The asset history lives in three systems plus a spreadsheet that reconciles them, and the reconciliation is manual.”
“We have twenty years of inspection records. The recording format changed twice. Nobody is confident the old ones are comparable to the new ones.”
From logistics operators and freight brokers:
“Our analysts rebuild the same lane performance view every month.”
“The forecasting model is a workbook. One person maintains it, and everyone else waits for him.”
“Carriers ask us for their own performance numbers, and we pull them by hand, one at a time.”
From public bodies and archives:
“We are required to make this available. In practice ‘available’ means people email us and we send them a file.”
“Someone built a good internal tool for this once. They left.”
If one of these is a sentence you have said out loud, the rest of this article is about what to do with it—including the parts most vendors will not tell you.
If none of them are, you may not have this problem yet, and a section below explains when building a portal is the wrong move.
Do you actually need a data portal?
It’s worth being honest, because the answer is sometimes no. You probably do have it if:
- More than two or three groups outside your team want your data.
- Requests arrive in a form you cannot automate: different regions, different variables, and different time windows each time.
- Your data comes from multiple collection efforts, and the structures do not match.
- Some records are restricted and some are open, and the distinction currently lives in someone’s head or in a column only one person understands.
- Data keeps arriving—from collaborators, field teams, and partner organizations—and someone merges it by hand.
- Reports for funders, boards, or regulators are built from scratch each cycle rather than generated.
- A funder, board, or evaluation has asked what the impact of years of data collection actually was—or your next reporting cycle requires that answer, and producing it means a week of manual work.
If instead you have one reasonably clean dataset, a stable structure, and a handful of internal users, you do not need a platform. Skip to the section on when not to build one.
The short version:
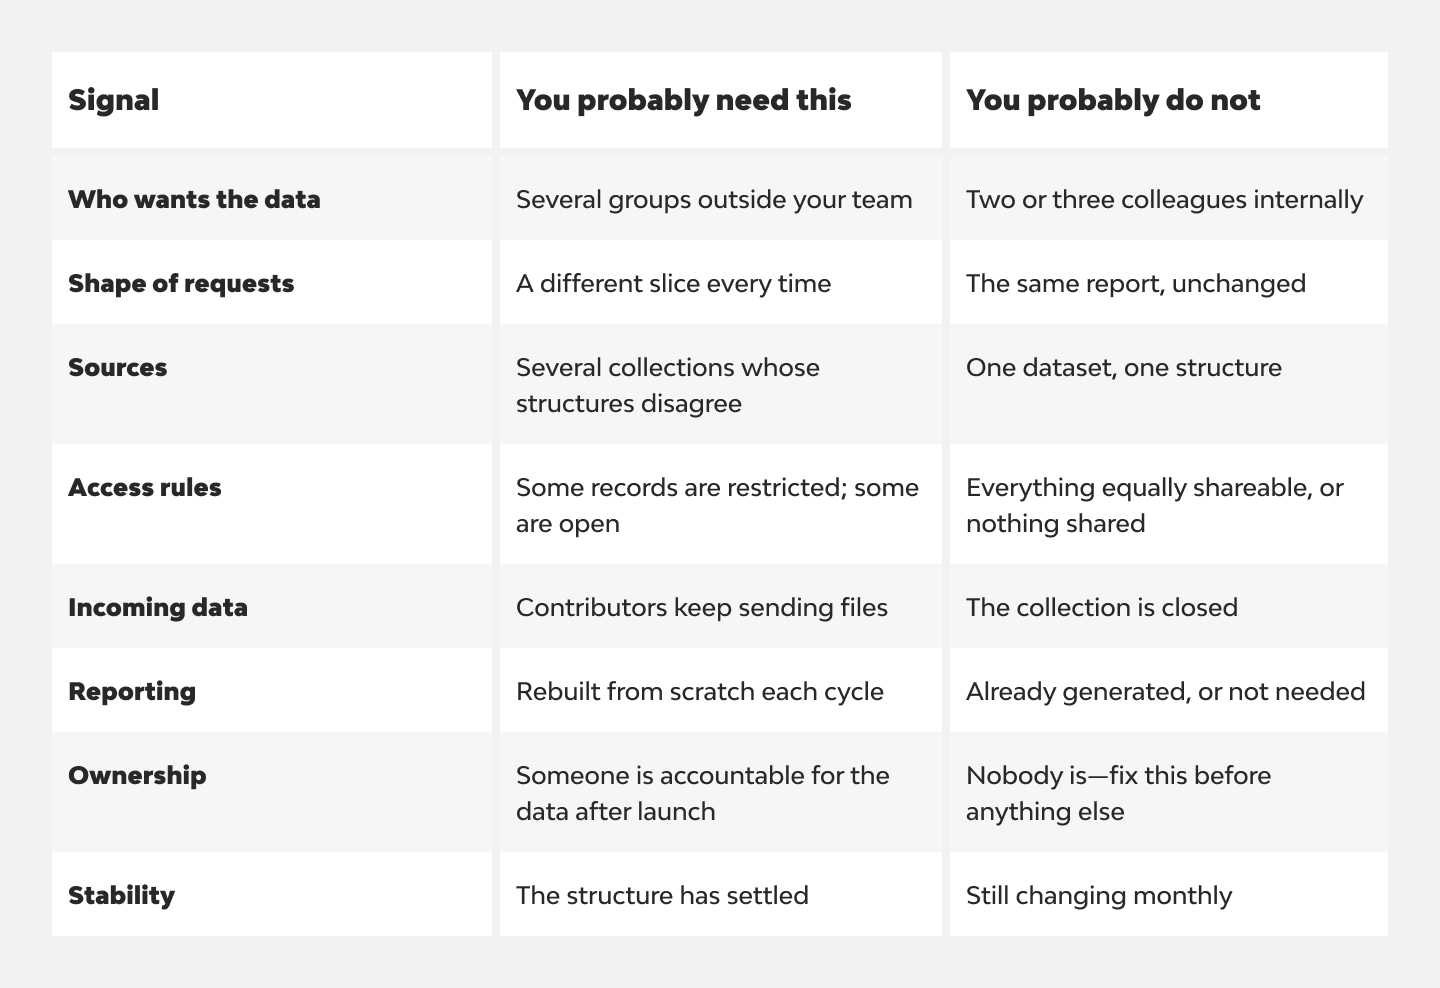
Two rows are prerequisites, not signals: if nobody will own the data, or the structure still changes monthly, fix that first—no number of rows on the left compensates. For the remaining rows, one on the right does not disqualify you; four or more does.
What is a data portal, and how do dashboards fit into it?
A data portal is the whole system: one structured database, plus a website where people filter, view, and export. Dashboards are part of it—the ready-made views that sit alongside the ability to build your own.
The word people usually reach for is “dashboard,” and that is a reasonable place to start—most of these platforms end up with dashboards in them. It’s not the whole thing, and scoping the project as only that is where estimates go wrong.
A dashboard is a set of prepared views: this chart, this map, and this summary kept up to date. Very useful, and often exactly what your internal team wants. But the person who emails you for data wants something a dashboard cannot give them—to define their own subset, check it closely enough to trust it, and take it away in a format their own tools read. A portal does both. The dashboard is the top layer; the querying and export underneath it are what make the dashboard worth maintaining, because they mean the same data serves people whose questions you did not anticipate.
The work decomposes into five layers, and they are not equally hard.
- Consolidation. Scattered spreadsheets, tables, and databases merged into one structured, documented model. This is where most of the real effort goes, and where most estimates are wrong.
- Access. Users open a web page: no installation, no credentials request, no email to your team.
- Querying. Users select the variables they want and set filters: a numeric range, a category, and a flag. They see how many records match before committing, which can confirm whether the query is working as intended.
- Visualization, including dashboards. Maps for anything with coordinates, time series for monitoring data, and breakdowns for survey results and indicators—both as prepared dashboard views for recurring questions and as charts users generate from their own selection. The point is not decoration. A coordinate error or a unit inconsistency is invisible in a table of 20,000 rows and obvious on a map.
- Export and reporting. The subset leaves in a format the recipient’s workflow accepts. For research data, that usually means more than CSV: XLSX, a serialized dataframe, a GIS shapefile, and netCDF. For organizations reporting to funders or boards, it more often means a generated report in a fixed template—the same output currently rebuilt by hand every cycle.
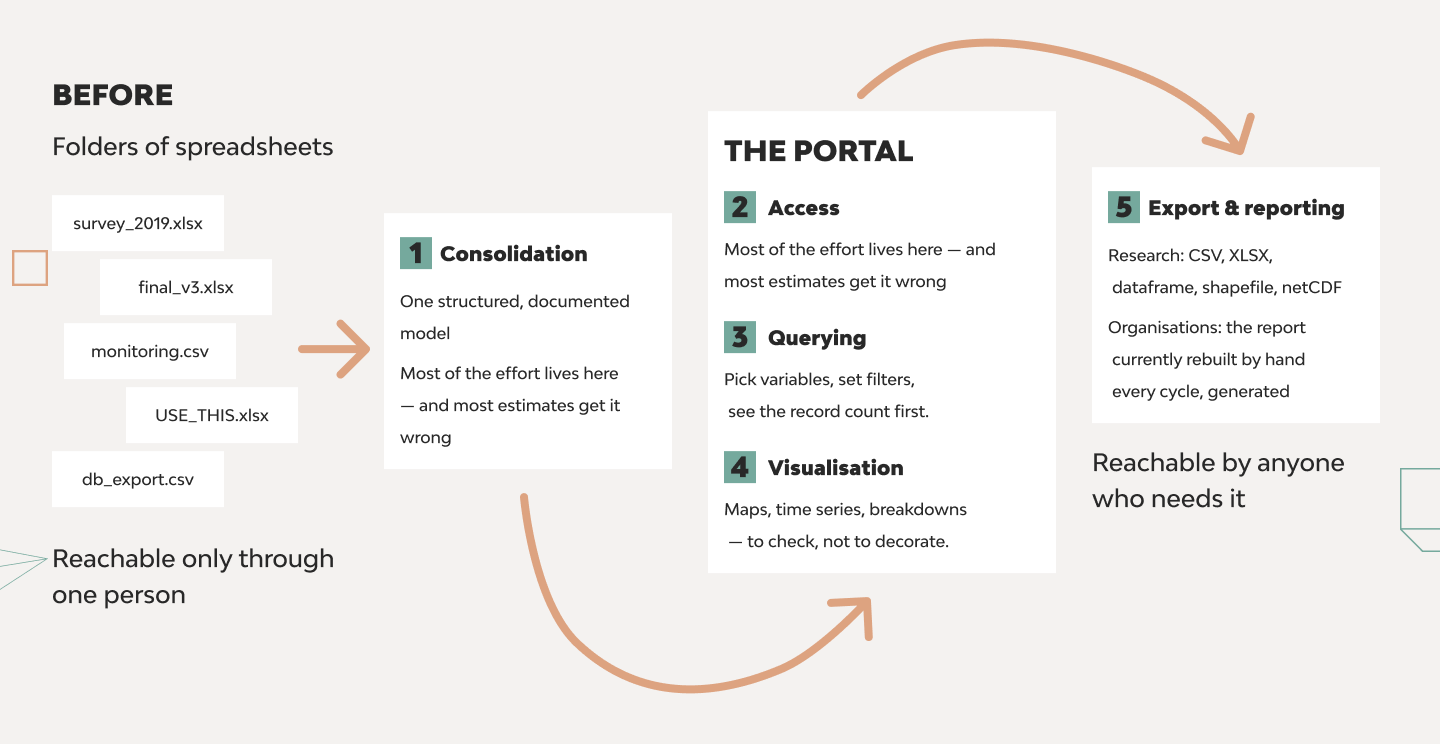
The five layers are not equally hard. Consolidation is where the cost is.
In plain terms: what goes in and what people get out
If the rest of this article is more detail than you need right now, this section is the whole idea.
You have data. We turn it into one structured database and put a website on top of it. People then find what they need, look at it, and download it—without emailing anyone.
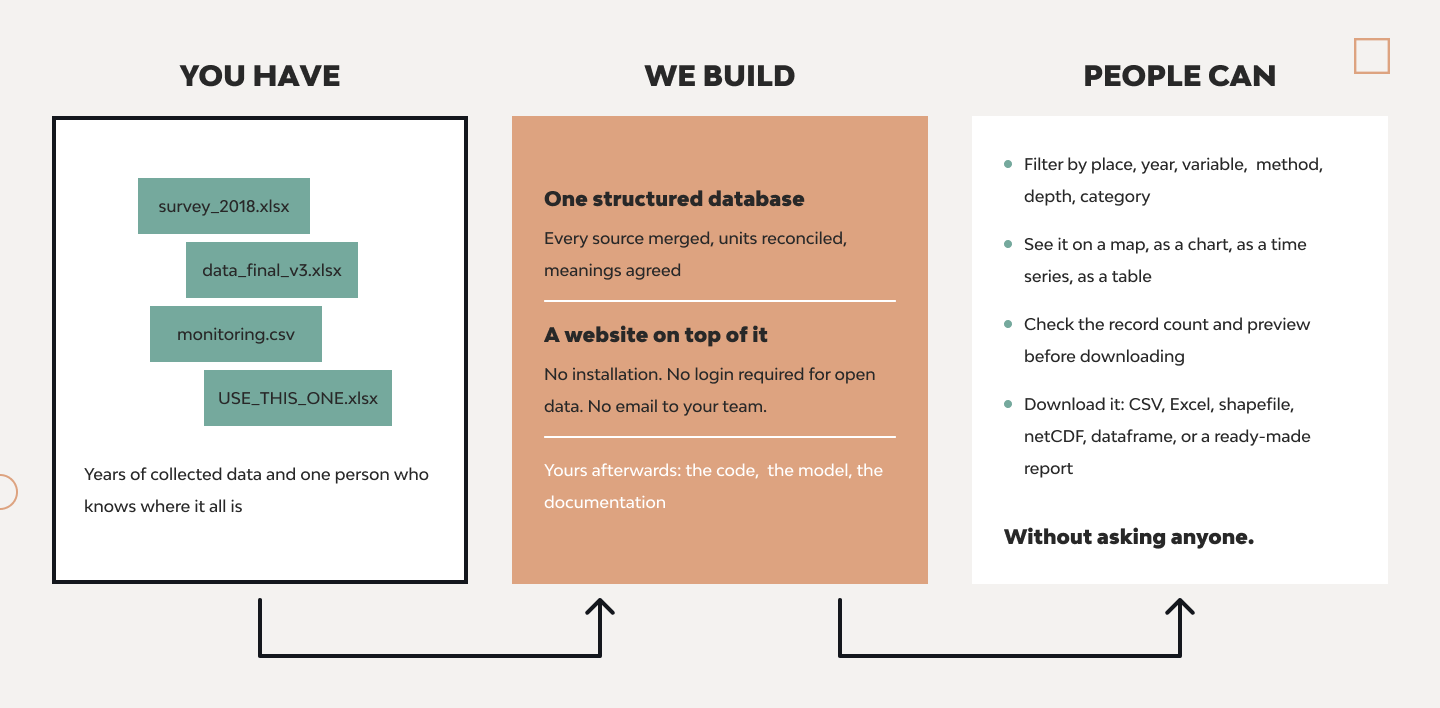
The person who used to answer every data request by hand is no longer in the loop.
Concretely, here is what “people find what they need themselves” means. The examples are from the two platforms described later in this article.
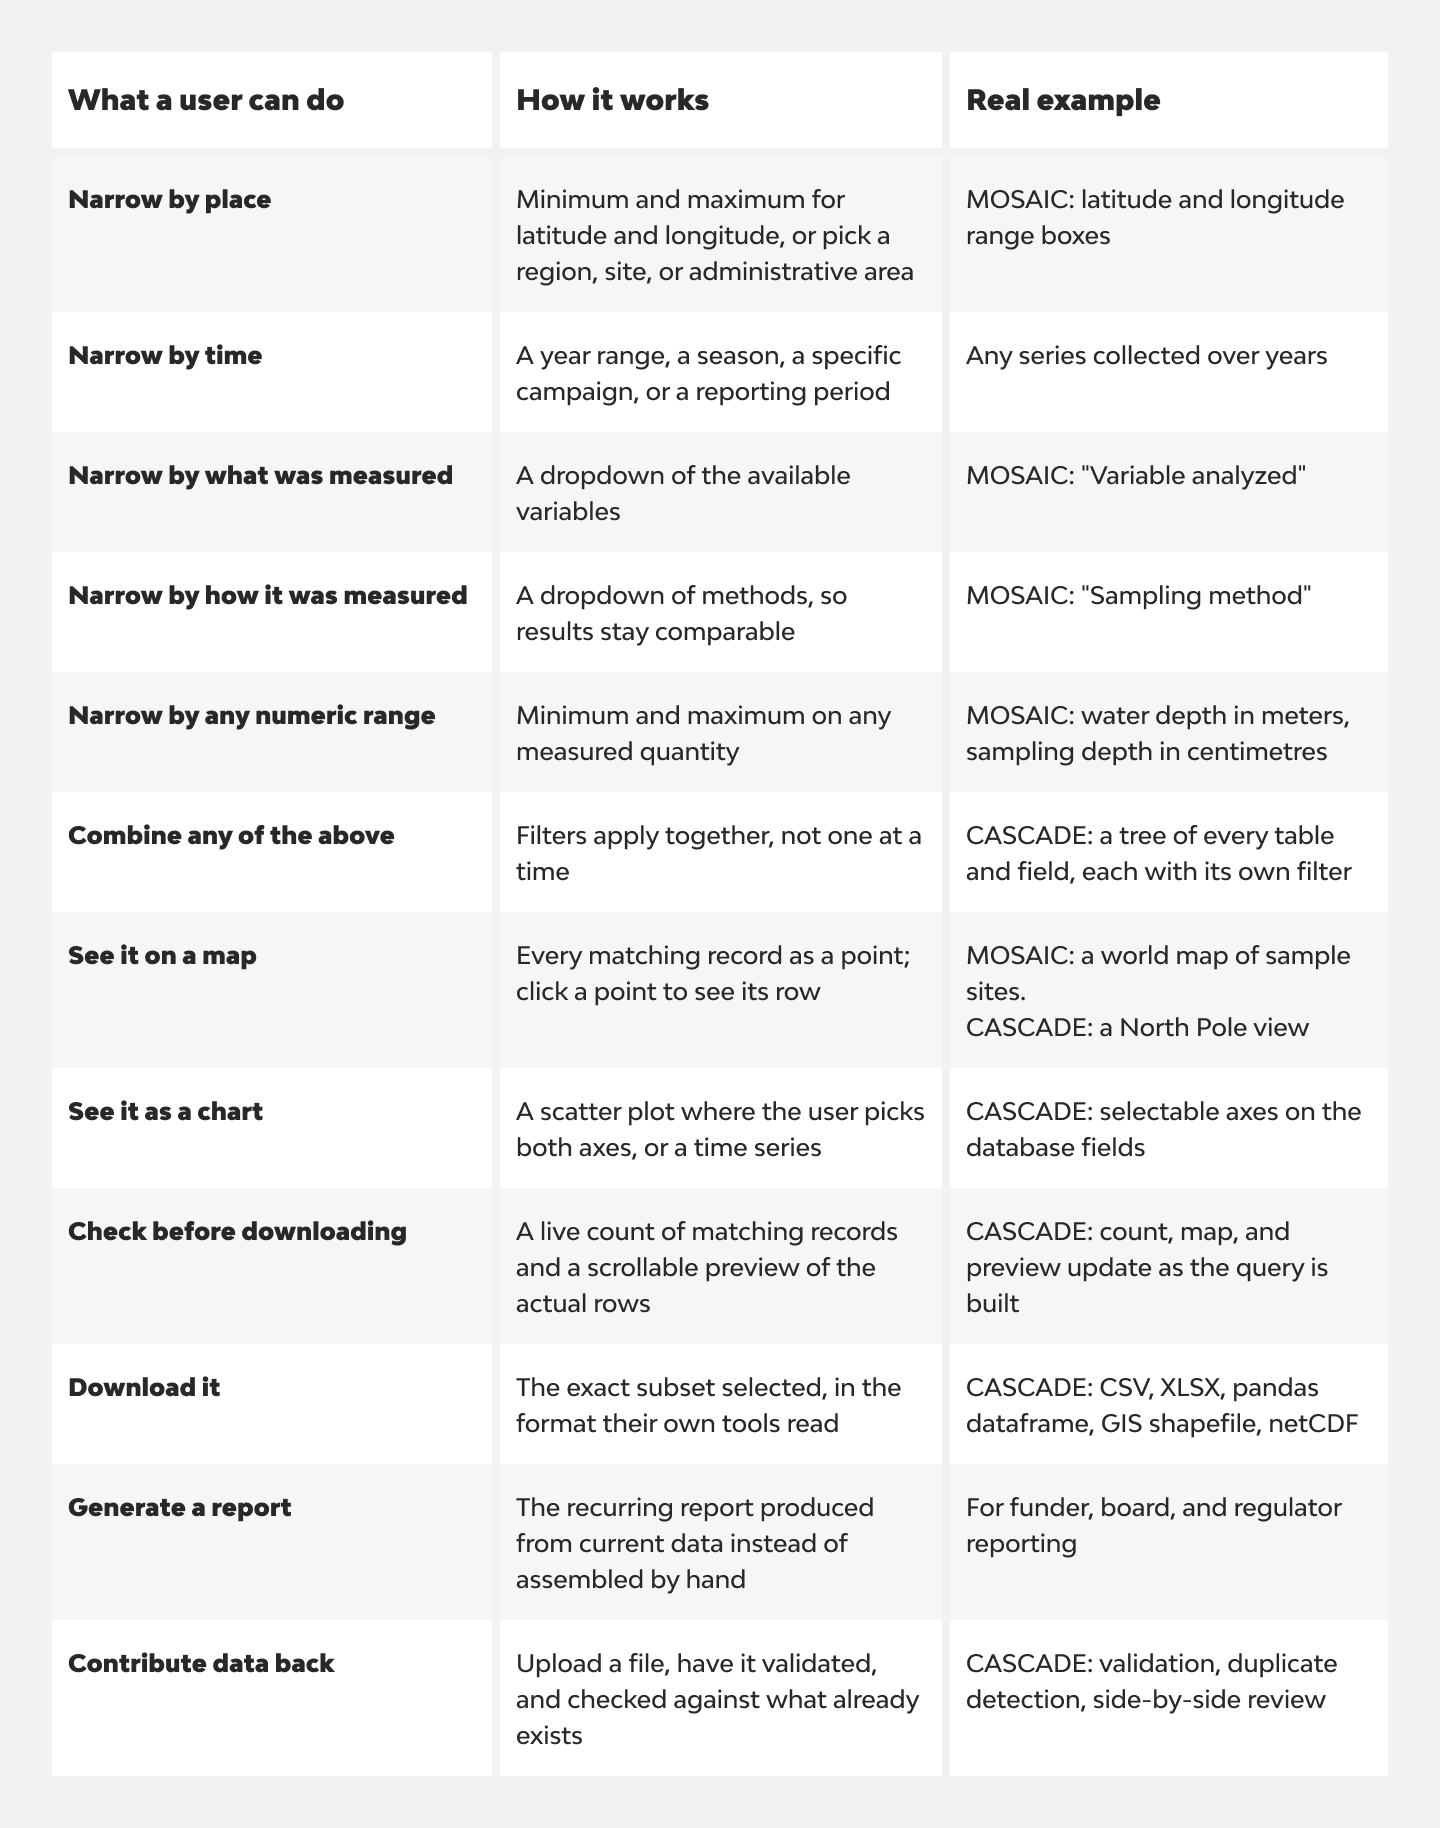
On download formats, the short answer is: whatever your users actually work in. CSV and Excel always. For anything with coordinates, use a GIS shapefile or GeoJSON. For scientific and climate data, use netCDF. For people working in Python, a ready-made dataframe that removes an entire parsing step on their end. For reporting, a generated PDF or Word document in your own template. Each format is small work individually and awkward to add after the fact, so decide the list early.
Not everything above belongs in every project. A portal for program indicators may need place, time, category, a map, and Excel export, and nothing else. The point of the list is that these are the pieces, and you choose from them.
What is this thing called? A terminology map
The same project gets a different name depending on who describes it, which is why organisations with identical problems struggle to find each other’s solutions—and why quotes for the same work arrive with wildly different assumptions attached.
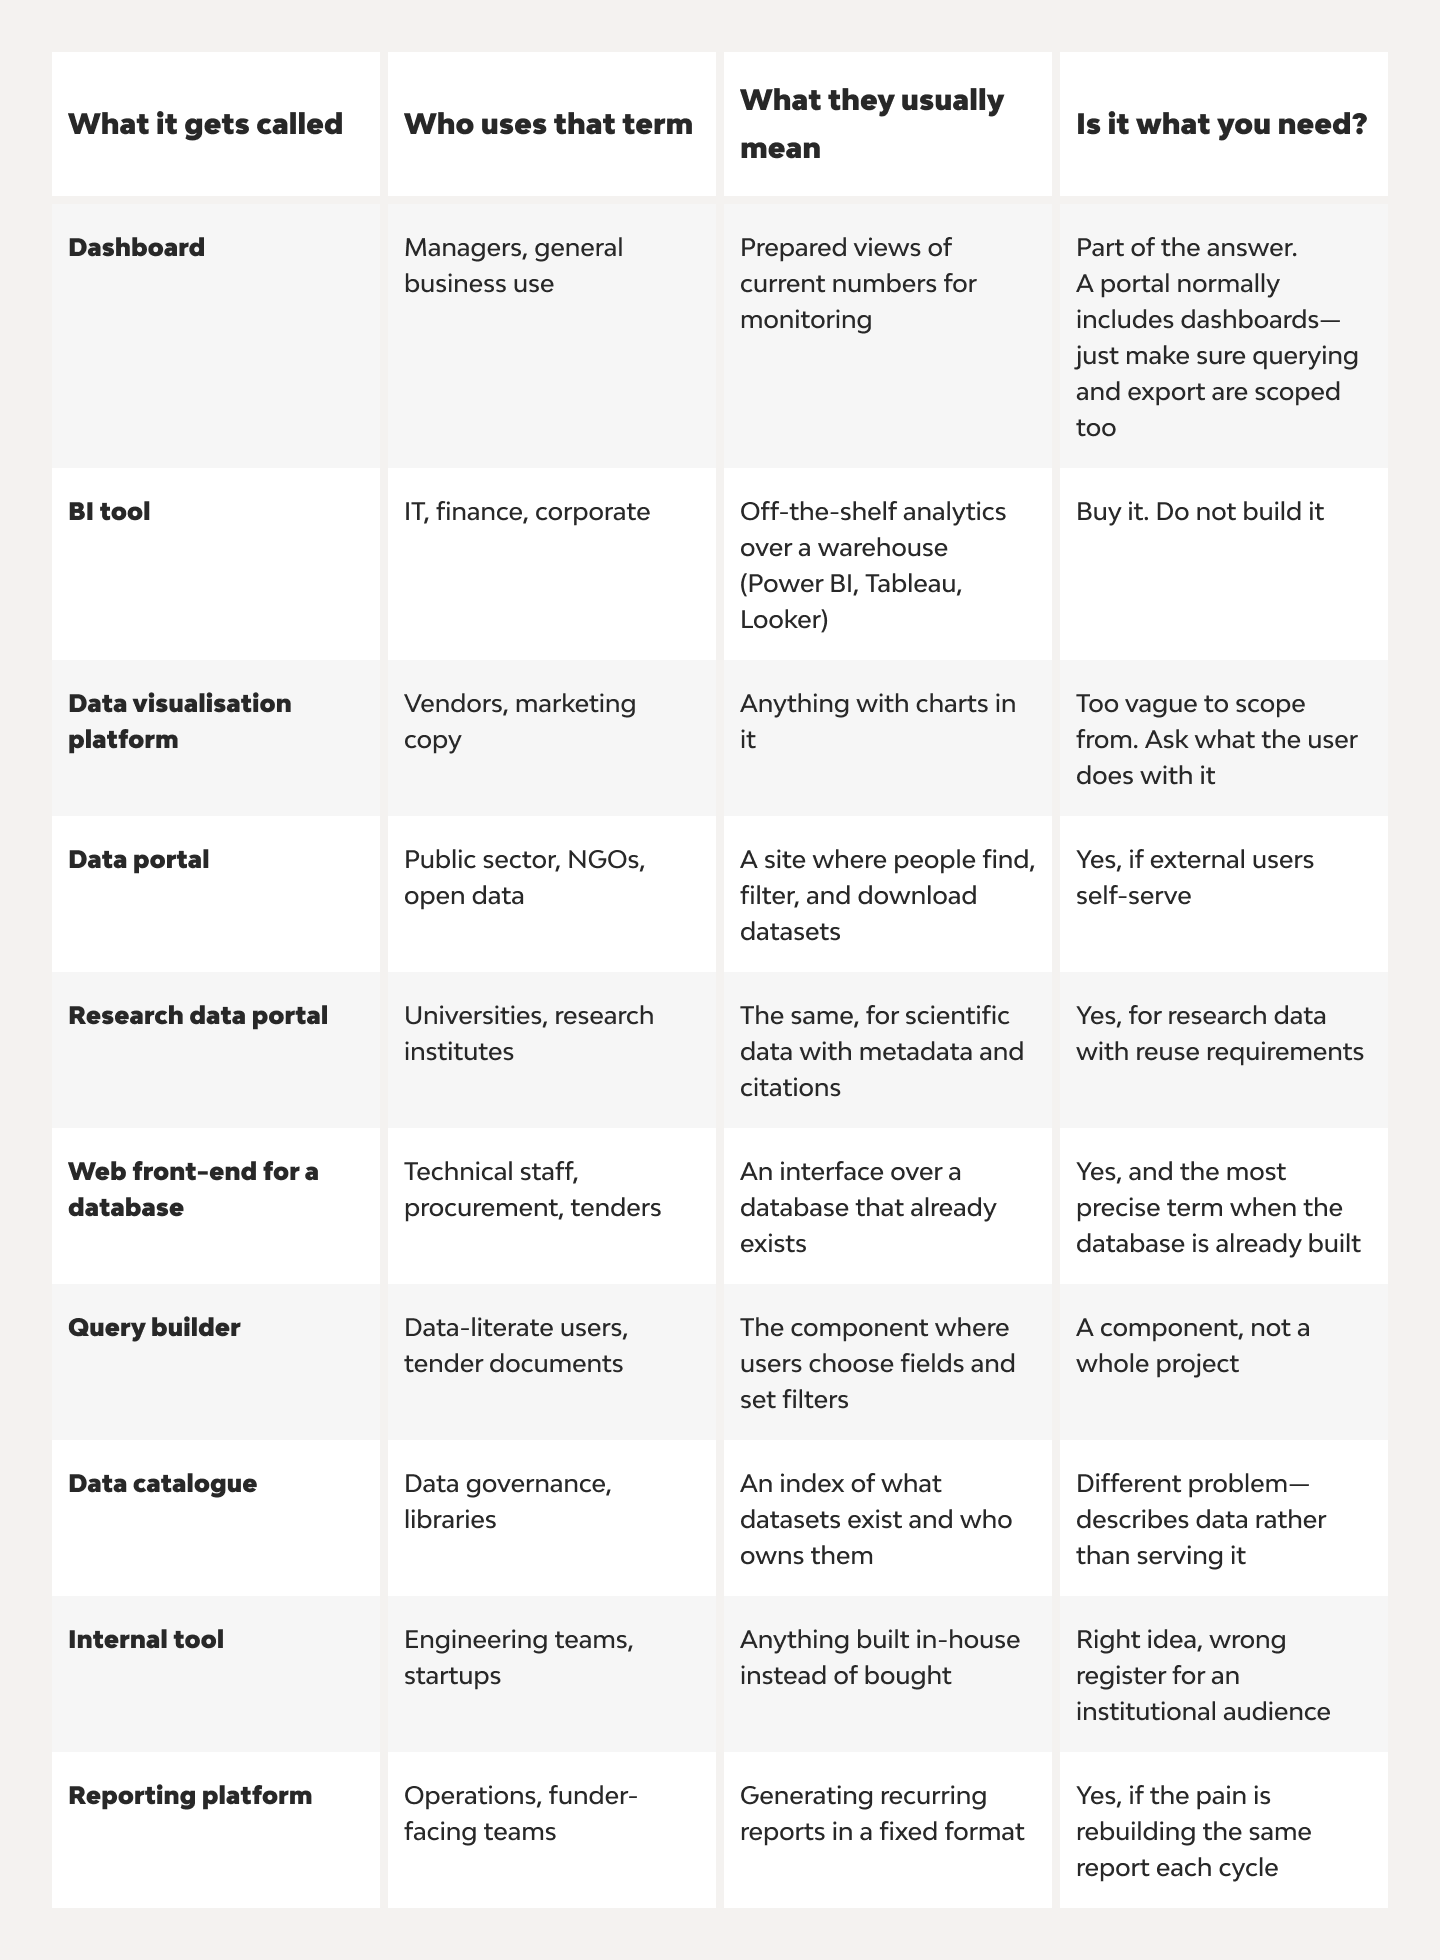
Two practical uses for this table.
If you are writing a tender or a brief, the most precise phrase is usually the least fashionable one. “A web front-end to our existing PostgreSQL database, with a graphical query builder and export” tells a bidder exactly what to price. “An interactive data visualization dashboard does not, and you will receive quotes that differ by a factor of three because each bidder guessed differently.
If you are searching for who can do this, try more than one vocabulary. A team that describes its work as building data portals and a team that describes it as building web front-ends for scientific databases may be doing identical work. We usually show up under “dashboards” and “data visualization,” and the tender that describes the same project most accurately calls it a web front-end with a query builder.
Where data portal projects actually break
This is the part worth reading if you are deciding whether to commission this kind of work, because these problems show up in month two and are not in anyone’s initial requirements.
Sources that disagree with each other. Two collection efforts recorded the same measurement under different names, in different units, with different precision. One used decimal degrees, the other degrees and minutes. One recorded a detection limit, the other left the cell blank, and “blank” means “below detection” in one file and “not measured” in the other. Reconciling this is not a data-cleaning task you can hand to a script. It requires deciding what the harmonized model means, and those decisions need domain people in the room. Budget for that as design work, not as data entry.
Metadata that was never recorded. A number without its method, instrument, sampling depth, or collection protocol is not reusable by anyone outside the team that produced it—they cannot tell whether it is comparable to their own. The same is true of a monitoring figure with no note on how it was counted or a survey response with no record of which version of the questionnaire was used. Building a portal exposes exactly how much context lives in people’s memory rather than in the data. You will have to decide what to do about records you cannot fully describe. Discarding them is usually wrong; publishing them without qualification is also wrong.
Restricted and open data in the same tables. This is the single most common reason organizations do not open their data, and it is solvable. It needs an explicit restriction status on records, roles that determine what each kind of user can see, and a default for anonymous visitors that is open data only. The engineering is straightforward. The hard part is deciding the policy—what is embargoed until publication, what is confidential to a partner, and what can be shown in aggregate but not per record—and that decision belongs to you, not to your developer. Get it settled before development starts, because it shapes the data model.
Data about people. If your records describe individuals—survey respondents, program participants, patients, beneficiaries—this is not the same problem as restricted access, and treating it as such is the most expensive mistake available. Role-based permissions control who sees a record. They do not make a record safe to publish. Before anyone designs the schema, you need to decide which fields are personal data at all, what the lawful basis for holding them is, what the smallest unit you are willing to expose publicly is, and whether aggregation at that level can be reversed by combining it with something else. A monitoring dataset with location, date, and demographic detail can identify someone even with the name removed. These answers determine the data model, the aggregation layer, and what the export can contain. Retrofitting them means rebuilding all three. Under GDPR, the cost of getting this wrong is not only a rebuild.
Indicators that changed definition partway through. You measured something one way for six years, then improved the methodology. In a time series, it shows up as a step change that looks like a real finding but is not. Someone has to decide whether that is one indicator or two, whether the older values can be restated, and what a portal user is told when they cross the boundary. This is not an engineering decision, and if nobody makes it explicitly, the platform will publish a misleading chart with complete confidence. The same applies to changed geographic boundaries, changed category lists, and any survey question whose wording moved.
Incoming data from the field. If contributors send you data—collaborating researchers, field teams, partner organizations—uploads are not a file drop. A usable ingest path validates field names and types, range-checks numeric values so that an impossible latitude is caught immediately, and, the part people forget, checks whether the incoming rows already exist. Matching on location and date with a configurable tolerance surfaces three cases: this row is already there, this row could complete an existing record, or this row is new. Show the candidate and the existing record side by side with the differences highlighted, and let a person decide. Automatic merging destroys trust the first time it gets one wrong.
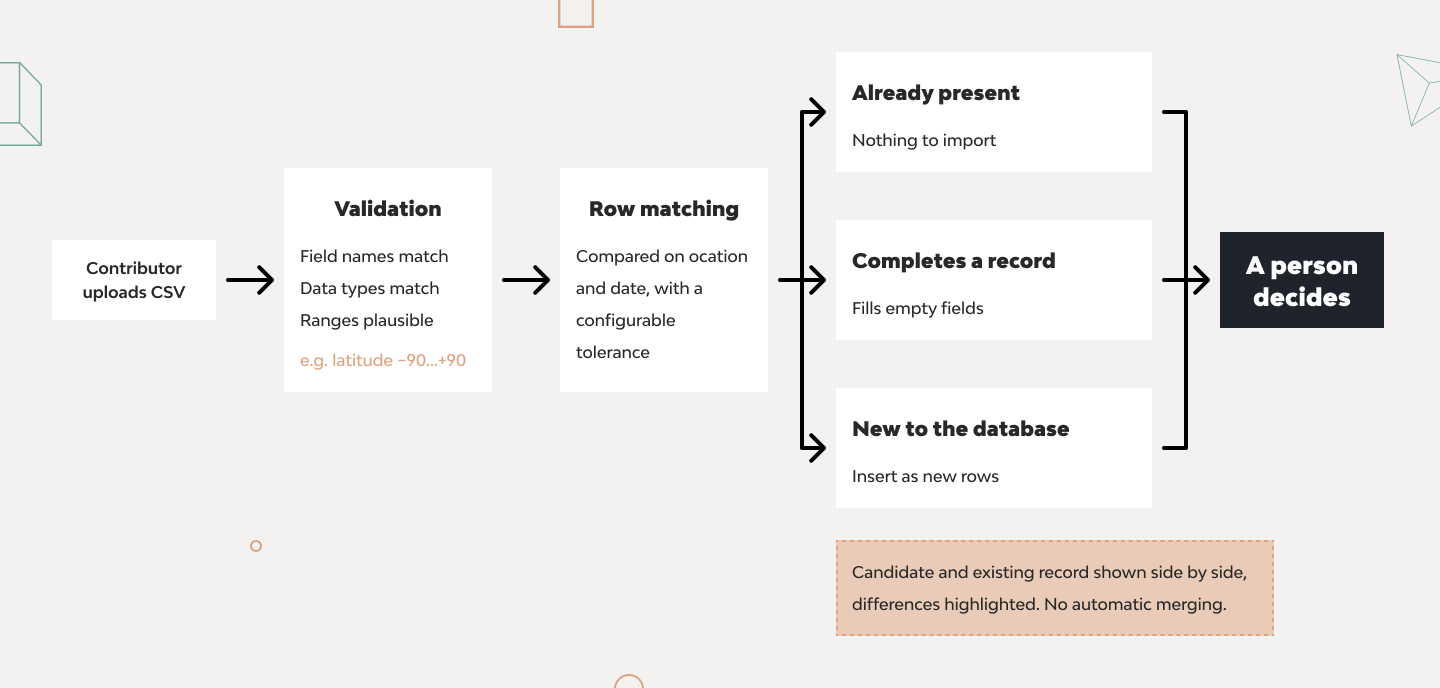
A contribution path that people trust ends in a human decision, not an automatic merge.
Versioning and citability. If people publish analyses based on your data, the version they used must remain retrievable, or their results won’t be reproducible. Deciding how versions are cut and cited is a design question with real consequences, and it is much cheaper to answer at the start than to retrofit.
Who owns this in three years. Portals built as a project deliverable, with no named owner, afterward stop being updated and then stop being trusted. This is the most reliable predictor of whether the platform will still matter after the funding period. Two practical requirements follow: the code must be readable and documented well enough for someone else to pick up, and structural changes to the data must be possible without a developer on retainer.
When you should not build a data portal
A custom portal is the wrong answer when your data is already clean and stable, when nobody will own it after launch, or when an existing repository or off-the-shelf catalogue would do the same job for free.
An honest list, because commissioning this work when you do not need it is expensive and demoralizing.
- Your data fits one well-maintained file and has a few internal users. A portal solves a coordination problem you do not have.
- Nobody will own the data after launch. Fix this first. Without an owner, the platform decays into a misleading snapshot, which is worse than a spreadsheet someone maintains.
- The structure is still changing every month. Wait until the model is stable enough to build against, or you will pay for the same work twice.
- An existing repository would do. For depositing and citing datasets, institutional repositories, Zenodo, Dataverse, or a domain data center are designed for that and cost nothing to build. General-purpose data portal software such as CKAN handles cataloging and publishing well. Custom development earns its cost when users need to query across a structured, domain-specific model, when contributors need a validated ingest path, or when access rules are more complicated than public-or-not. If none of those apply, use the off-the-shelf option and spend the money elsewhere.
- All you want is internal reporting over data that is already clean and in one place.Then a BI tool does it, and you should buy one rather than build. Custom work earns its cost when the data has to be consolidated first, when external users self-serve, or when access rules are more complicated than public-or-not.
What this looks like in practice: two data portals
We have built two of these for sediment geochemistry databases: same domain, different problem in each.
A global database where the whole point was harmonization
MOSAIC—the Modern Ocean Sediment Archive and Inventory of Carbon, held at ETH Zürich—compiles organic carbon data from marine sediments worldwide, along with isotopic composition and associated sedimentological parameters. The data comes from individual studies conducted by different groups over decades, using different methods and reporting conventions. Version 2.0 includes data from more than 21,000 individual sediment cores from continental margins globally, expanding the original database’s spatiotemporal coverage by more than 400%.2
The hard requirement was not visualization. It was that a researcher who did not collect any of this data should be able to find the subset relevant to their question and trust it. That means the harmonization has to be visible: which method produced this number and what it is comparable to.
We built the interactive map interface on top of the harmonized database, with filtering across geochemical parameters. One requirement shaped the design more than any other: the team maintaining it are researchers, not developers, and they needed to add new filters as the database grew without engineering involvement. The database is continuously expanding, and contributors submit new data using a template workbook—so anything that required a developer in the loop would have become a bottleneck within a year.
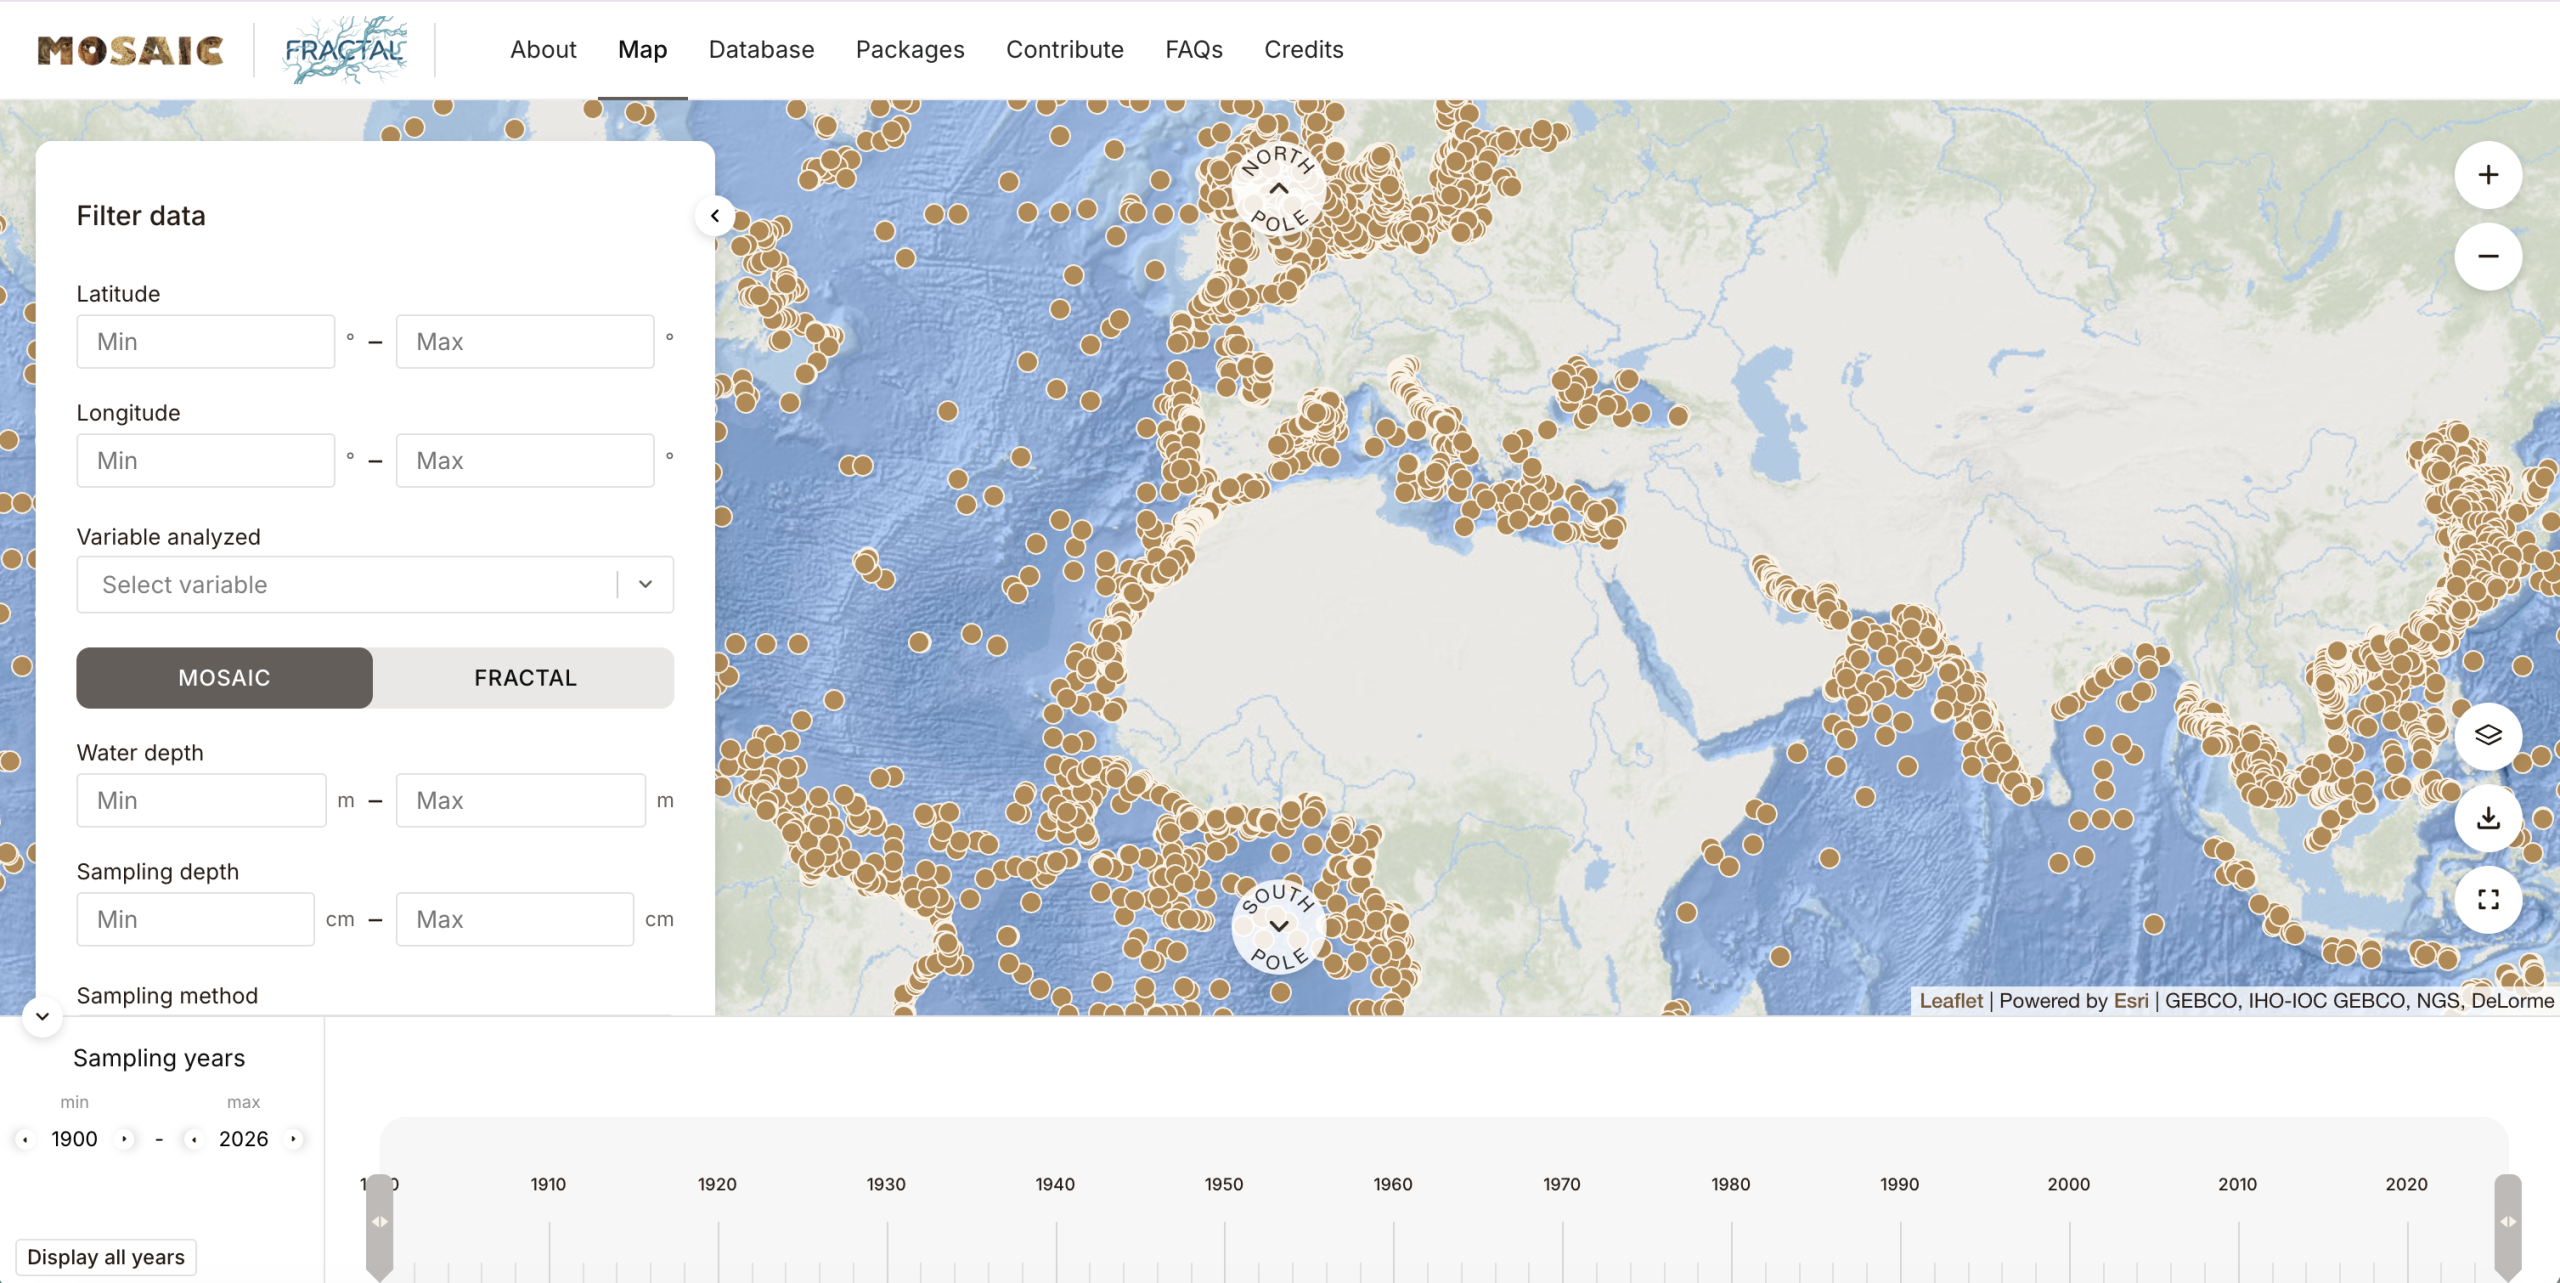
Every sample location in the database and the filters that narrow them down. Ranges for coordinates and depths, dropdowns for variables and sampling methods. This is what “define your own subset” looks like in practice—and the dropdowns are the part that lets the research team extend it without a developer.
Three engineers, from 2023. Dr. Sarah Paradis at ETH Zürich, who leads MOSAIC, has spoken publicly about working with us.
If your objection is “our data is too inconsistent to build anything on”—that was the starting condition here, and harmonizing it was the deliverable, not a prerequisite.
An Arctic database where the problem was access and contribution
CASCADE, the Circum-Arctic Sediment Carbon Database, is an international collaboration curating data from across the Arctic Ocean: organic carbon, nitrogen, carbon isotopes, and biomarkers. It is openly available through the Bolin Centre Database, with a companion paper published in Earth System Science Data by Martens et al. (2021). Stockholm University’s Department of Environmental Science curates it.
The data was already public. The problem was that extracting a specific subset for a specific scientific question still required someone who knew the database structure. As the collection kept expanding, that dependency got worse, not better. Two things had to be solved at once: letting any scientist extract what they need without help and letting collaborators contribute data without someone merging spreadsheets by hand.
What we built on Django and Python over the existing PostgreSQL database:
A graphical query builder. The database is presented as a tree of tables and their fields, each with a checkbox for inclusion in the output and a filter appropriate to its type—a numeric range, a category, or a boolean flag. As the query is built, the user sees a live record count, sample locations plotted on a North Pole map view, and a scrollable preview of matching rows. Clicking a location on the map highlights its row in the preview. This is the difference between a query interface people trust and one they abandon: you can tell whether your filters are doing what you intended before you export.
Exports in the formats the work actually needs. CSV, XLSX, a pickled pandas DataFrame, GIS shapefile, and netCDF.
A validated contribution path. Uploaded CSV data is checked against the database’s field names and types, and numeric values are range-checked—a latitude outside −90 to +90 is caught immediately. Then each incoming row is matched against existing records by latitude, longitude, and date, with configurable tolerances, and classified as already fully present, able to complete an existing record, or entirely new. Candidates are shown side by side with the existing record, differences highlighted, and a person makes the final call. No automatic merging.
Three levels of access. An anonymous visitor can use the query builder, but only against public data; the public/embargoed distinction is a flag on the records themselves. Registered users can query across both. A subset of those users have editor permission, which unlocks the upload path.
If your objection is “we can’t open this because some of it is restricted”—this is the shape of the answer. The restriction lives in the data, the roles enforce it, and the default for an anonymous visitor is open data only.
Why these two are relevant if you are not a research institute
Both examples are geochemistry, because that is where we have public reference projects. The mechanics are not specific to it.
Swap the sediment cores for monitoring records, survey responses, or program indicators, and every component maps across. A tree of tables and fields becomes a picker over your own variables. Range filters and a live record count work the same on dates and demographics as on depths and latitudes. The map becomes whatever your data has a shape in—sites, districts, catchments. The public-versus-restricted flag becomes your own disclosure policy. The upload path with duplicate detection becomes how a partner organisation submits a quarter of data without anyone merging spreadsheets by hand.
What genuinely differs is what we set out in the breakage section: if your records describe people, the aggregation and disclosure layer is real work these two projects did not need. Do not let anyone quote it as if it were free.
Do we integrate this into your existing site or build it standalone?
Almost every organisation asking this question already has a website, usually on a CMS—WordPress, Drupal, TYPO3, or Wagtail are the common ones in European institutions. The reasonable question that follows is whether the portal becomes part of it.
Usually not inside it and usually visually continuous with it. A CMS is built to manage pages. It is not built to filter two hundred thousand records and serve an export, and forcing it to do so produces something slow that breaks on the next CMS upgrade. What people actually want from “integrated” is that it looks like one site, is accessible from the main navigation, and does not require a second login. All three are achievable without the portal living inside the CMS.
There are five delivery shapes, and they differ mostly in how much already exists on your side.
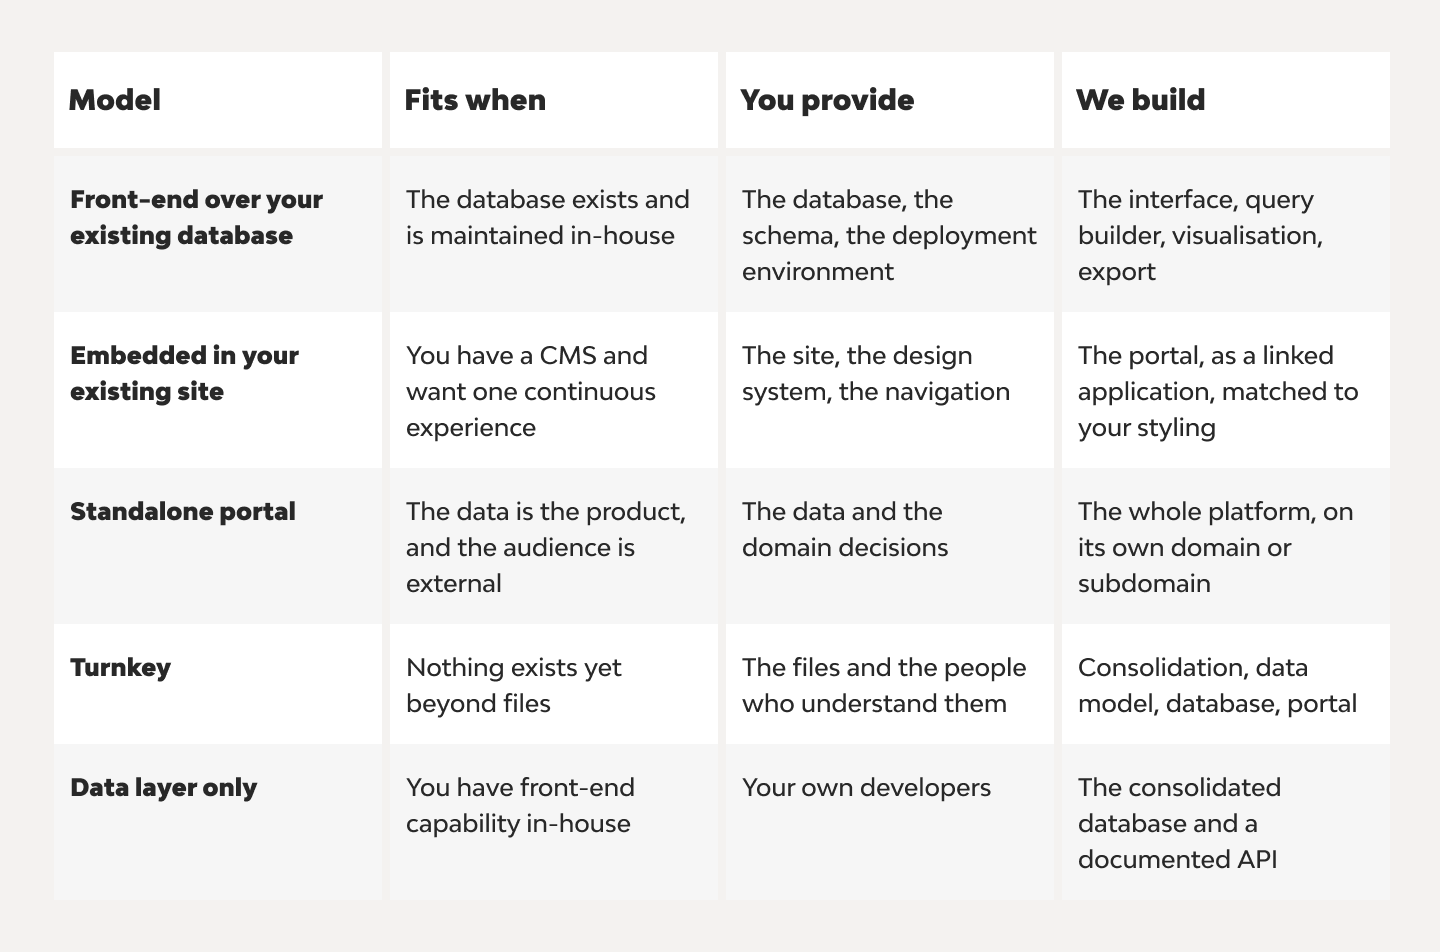
A few things worth knowing before you choose.
A subdomain is fine. Search engines handle data.yourorg.org perfectly well, and for a platform with its own navigation and audience, it is often the cleaner choice. If the portal is meant to strengthen the main site’s standing in search, a subfolder is the marginally stronger option. Do not let this decide the architecture; the difference is small, and the maintenance implications are not.
Single sign-on is a separate question from where the portal lives. If your institution has an identity provider, connecting to it is normally straightforward and worth doing. Decide it early, because it affects the role model.
“Turnkey” mostly means we do the consolidation. That is the layer where the cost sits, and it is also the layer that cannot be outsourced entirely, because deciding what a harmonised field means requires the people who know the data. Expect to be involved in whichever model you choose. Any quote that promises consolidation with no time from your team is underestimating it.
If you already have a database, say so early and precisely. A front-end over a working, documented database is a fundamentally different project from consolidation plus a front-end—different cost, different duration, different risk. Bidders who do not know which one they are quoting for will price the bigger one or discover it later.
Where does the data actually live?
Every one of these conversations reaches this question, and it is worth answering plainly, because the answer affects cost more than almost any other technical choice.
If you already have a database, that is the best possible starting point. A front-end over a working PostgreSQL database is the cheapest version of this project—CASCADE above is exactly that pattern. Say so in your first email to any vendor.
If your “database” is a set of pandas scripts and Excel exports, that is also fine and more common than people admit. It means the schema exists in someone’s head and in code rather than in a system, which is recoverable. It means that consolidation is part of the project rather than something you have already done.
What we would normally use, and why:
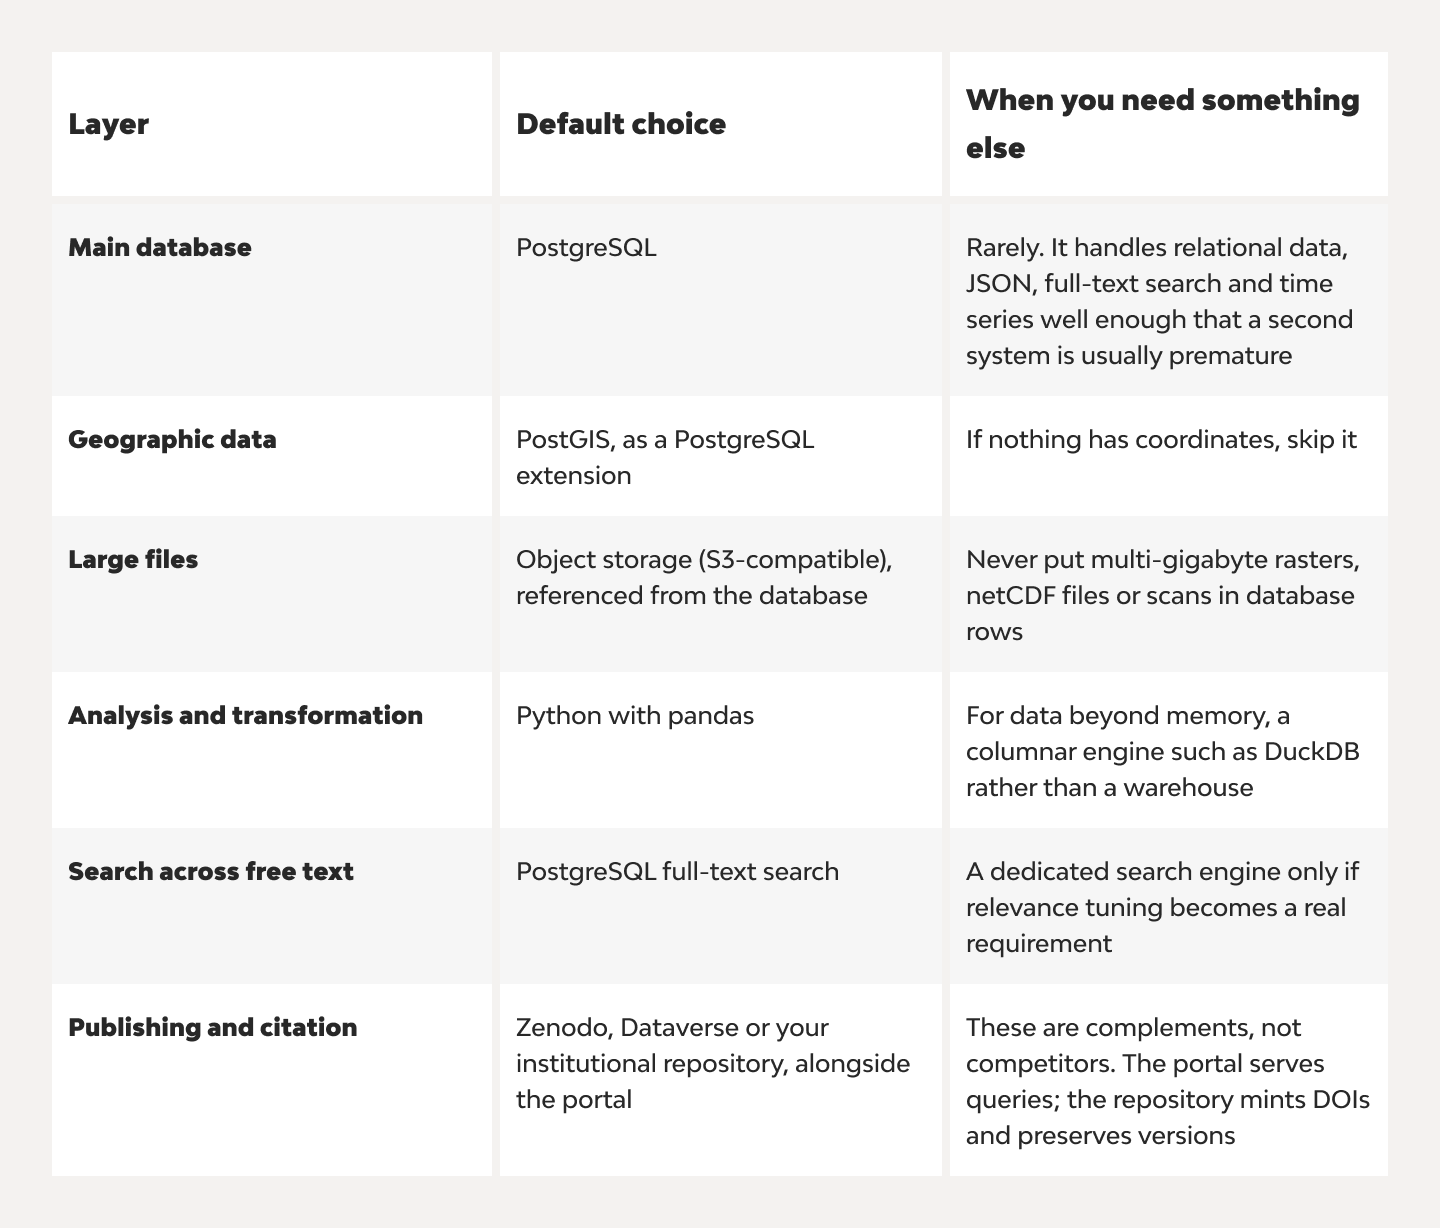
The pattern worth noticing is one database, extended where needed. A surprising number of proposals arrive with a warehouse, a search cluster, a cache layer, and a message queue for a dataset of two hundred thousand rows. That is not architecture; it is an invoice.
A licensing note, because it matters for public bodies. Open source is not one thing. PostgreSQL and Django are permissively licensed with no obligations attached. PostGIS is GPL—used as a database extension, it does not make your own application code a derivative work, but if your procurement rules mention copyleft, flag it. CKAN, the widely used open-data portal platform, is AGPL-3.0, and its community treats extensions as derivative works that must also be AGPL. That is entirely fine if you are publishing open data, which is what it was built for. It is a real constraint if you intend to build proprietary extensions or fold it into a closed system. Tenders that say “no proprietary or costly licesnes” usually mean “no license fees” and do not consider copyleft at all. Be explicit about which you mean—and ask your own legal people rather than taking a vendor’s word for it, including ours.
What stops happening once it is live
The honest way to describe the outcome is not a percentage. It is a list of things that stop being part of anyone’s week.
The data request stops being a task. Anyone who wants a standard slice of open data gets it themselves, with no one from your team in the loop. What remains is governance—approving accounts where you choose to, reviewing contributed data. Hours per month instead of hours per request.
The report stops being rebuilt. The quarterly assembly job becomes a set of parameters and a generated output. The four days go back to the people who were spending them.
“Which version is current” stops being a question you ask a person. There is one place, and it is the answer.
The single point of failure in access is no longer a person. When the one who knows the files goes on leave, changes role, or leaves the organisation, the data, the schema, and the documentation stay. The single point of failure in stewardship remains—someone must still own the data. For organisations whose data outlives their staff turnover—which is most of them—this is the durable part of the value, and the hardest to feel until it is tested.
Showing your work stops no longer requires a week of preparation. A founder, a board, a regulator, or a journalist can be sent a link. What was previously invisible because it was expensive to demonstrate becomes something you can point to. One that lives in a spreadsheet can only be checked by a manual audit that, in practice, never happens—which is why nobody, including its author, can tell whether it is right by looking.
Errors become findable. A calculation that lives in code can be tested, reviewed, and version-controlled. One that lives in a spreadsheet cannot be, which is why nobody, including its author, can tell whether it is right.
What does not change: someone still has to own the data. The platform removes the manual work, not the responsibility.
What you actually own at the end
This matters more than it sounds, because the difference between a platform you own and a platform you rent from whoever built it shows up three years later, when the original team has moved on and you need one thing changed.
A working platform and the ability to change it. Mainstream framework, no exotic dependencies, readable code with comments in English. The practical test is whether a competent developer who has never met us can pick it up and make a change. That is what keeps you from being locked in—to us or to anyone.
The harmonized data model. Often the most valuable thing produced, and the part that outlives the interface. The decisions about what a field means, which units are canonical, and how sources reconcile are the hard intellectual work of the project. Once made and documented, they belong to you, and they remain useful even if the platform is rebuilt on something else one day.
Documentation written for two different readers. One for the people using the portal, one for whoever maintains it next. The second is the one vendors skip and the one that determines whether the platform survives.
A deployment path your own people can run. Environment setup, deployment steps, backup and restore. If a release requires us, you do not own it.
The ability to extend the data without a developer. Structural changes to the database should be possible outside the application, with the front-end adapting rather than needing a rewrite. In practice this is the difference between a platform that grows with your collection and one that freezes on the day we hand it over.
Training and a support period with defined response times. Sessions are recorded, so the people who join next year get them too.
No license bill you did not agree to. Built on open components, so there is no proprietary dependency quietly attached to your operating budget.
The underlying principle: you should be able to stop working with us and be fine. Agencies that make this difficult are protecting revenue at your expense, and the thing to check in any proposal is not whether the word “handover” appears, but whether the documentation and deployment path are named deliverables with their own line in the estimate.
What to specify in a tender for a data portal
The points below are what make competing bids comparable. Leaving them out is the usual reason quotes for the same project differ by a factor of three.
Points worth specifying, because leaving them out is what produces bids that are not comparable:
- Licensing. State whether proprietary or paid-license components are acceptable. If they are not, say so, or you will receive quotes that assume they are.
- Code and documentation. Require readable, commented code and documentation for both users and developers, in a named language. This is what makes the platform maintainable by someone other than the original vendor.
- Access model. Specify how restricted and open data are distinguished, what an unauthenticated visitor may see, and—if your records describe individuals—the smallest unit you are prepared to expose publicly.
- Export formats. List them. They are cheap to build in from the start and awkward to add later.
- Deployment. State what your existing environment is and who is responsible for changes to it.
- Accessibility. If WCAG compliance applies to your institution, name the level.
- Handover. Ask for a delivery estimate for a minimum viable version and separately for ongoing support options so you can see what maintenance actually costs before you commit.
Next step
Show us your data, even if it is a folder of spreadsheets with inconsistent column names. Under NDA, on a short call, we will tell you what could realistically be built from it, what we’d need to decide before anyone writes code, and where we would start. Not a demo.
DjangoStars has built Python and Django platforms since 2008.
- Is this a dashboard?
- It includes one. Dashboards—prepared views for the questions you already know people ask—are normally part of a data portal and often the part your own team uses most. Underneath is the queryable interface: users define their own subset and export it. Both usually belong in the project. The expensive mistake is scoping only the dashboard layer, then discovering that every unanticipated question still comes back to a person.
- We already have a database or a data repository. Does that change things?
- Substantially, and in your favour. A front-end over an existing, documented PostgreSQL database is the cheapest version of this project. Even an informal setup—pandas scripts, a stack of Excel exports, a database somebody built for one project—is a real head start, because the structure exists somewhere even if it has not been written down. Tell any vendor what you have in the first conversation; it is the single biggest factor in the estimate.
- How long does it take?
Roughly three weeks at the simple end, up to three months for a full build. The simple end means an existing clean database serving external, self-serving users: a handful of filters, a table view, and a CSV export. If the users are a few internal analysts, see the section on when not to build — that is a BI-tool purchase, not a project.
Three months means consolidating several sources, mapping and interactive geography, role-based access, multiple export formats, and a contribution path.
What moves the number, in rough order of impact:
- How many sources have to be reconciled, and how much they disagree. This dominates everything else.
- Whether a database already exists and whether it is documented.
- Mapping. Whether there is geography at all, and whether it needs to be interactive or static.
- Volume. Two hundred thousand rows and two hundred million are different engineering problems.
- Filters. How many, and whether your team must be able to add more without a developer.
- Export formats. CSV is trivial. Shapefile, netCDF, and generated reports are not.
- Access rules. Open to everyone is simple. Roles, approval workflows, and restricted records are not.
- Personal data. If records describe individuals, add the disclosure and aggregation work described above.
- Can our own team maintain it afterward?
- That depends on choices made during development, not after. Use a mainstream framework, avoid exotic dependencies, keep the code documented, and make structural data changes possible without touching application code. Make it a written requirement.
- Our data includes personal information. Can it still go in a portal?
- Yes, but the design question comes first, not the permissions. You decide what the smallest publishable unit is and whether aggregation at that level is reversible; the platform is then built around that. This is work, and it is the part most quotes leave out—so ask explicitly whether an estimate includes it.
- We do not want this open to everyone. What are the options?
- Access is not binary, and these options can be combined. Fully open, with no account needed. Open data is visible to anyone, while restricted data requires a login. Self-registration is limited to specified email domains, so only people at partner institutions can create an account. Registration is open, but an administrator approves each account before granting access—useful when you want to know who is using the data and why, which funders increasingly ask for. Or invitation-only. A common and sensible arrangement is open data for anonymous visitors, domain-restricted self-registration for partners, manual approval for everyone else, and a small number of accounts additionally holding permission to upload.
- We cannot share our data—can we still get an assessment?
- Yes, under NDA. In practice, a look at the real files, however messy, tells us more in an hour than a specification does in a week.
-
-
- Panko, R.R. and Halverson, R.P. (2001), reported in Panko, “Reducing Overconfidence in Spreadsheet Development.” Individual developers estimated an 18% probability that their spreadsheet contained an error; the measured rate for the same group was 86%.” ↩
- Paradis, S. et al. (2023). “The Modern Ocean Sediment Archive and Inventory of Carbon (MOSAIC): version 2.0.” Earth System Science Data 15: 4105–4125. doi:10.5194/essd-15-4105-2023. See also van der Voort, T.S. et al. (2021), Earth System Science Data 13: 2135–2146, doi:10.5194/essd-13-2135-2021.
↩
-
Hire experienced developers to build your next project with DjangoStars